The goal of CoronaShiny is to …
Installation
The development version from GitHub with:
# install.packages("devtools")
devtools::install_github("etc5523-2020/r-package-assessment-vvuu0009")
This package contains the shiny application and functions exploring the current state of coronavirus as at 31 July 2020.
Follow the link to go to the pkgdown website for more information: CoronaShiny
The main functions in this package includes:
-
launch_app: This function runs the Coronavirus Shiny Application exploring the state of Coronavirus as at July 31 2020
-
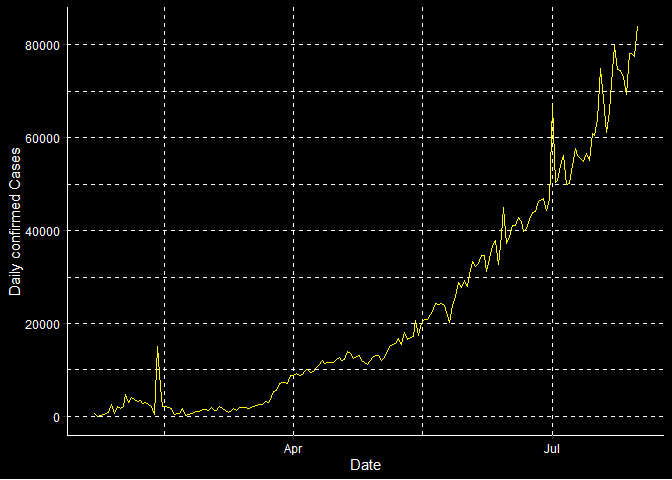
cumplot: This function produces a line graph of coronavirus cases for a selected case type and continent with date on the x-axis and daily cases for the selected
TypeandContinenton the y-axis. - selectInput01: This function changes the selectInput function of the Shiny app based on the desired input
This package also contains the following data sets:
- corona_cont: This data set shows the daily coronavirus cases by each continent by case type
- coronavirus_july20: This data set shows the cumulative coronavirus cases as at 31 July 2020 for each country
Example
Below displays a sample of both data sets:
library(CoronaShiny)
library(tibble)
corona_cont
#> # A tibble: 2,880 x 4
#>    date       continent type      cases
#>    <date>     <chr>     <chr>     <int>
#>  1 2020-01-22 Africa    confirmed     0
#>  2 2020-01-22 Africa    death         0
#>  3 2020-01-22 Africa    recovered     0
#>  4 2020-01-22 Americas  confirmed     1
#>  5 2020-01-22 Americas  death         0
#>  6 2020-01-22 Americas  recovered     0
#>  7 2020-01-22 Asia      confirmed   554
#>  8 2020-01-22 Asia      death        17
#>  9 2020-01-22 Asia      recovered    28
#> 10 2020-01-22 Europe    confirmed     0
#> # ... with 2,870 more rows
coronavirus_july20
#> # A tibble: 188 x 5
#>    Country        Continent `Total Confirmed` `Total Deaths` `Total Recovered`
#>    <chr>          <chr>                 <dbl>          <dbl>             <dbl>
#>  1 US             Americas            4562038         153314           1438160
#>  2 Brazil         Americas            2662485          92475           2008854
#>  3 India          Asia                1695988          36511           1094374
#>  4 Russia         Europe               838461          13939            637217
#>  5 South Africa   Africa               493183           8005            326171
#>  6 Mexico         Americas             424637          46688            327115
#>  7 Peru           Americas             407492          19021            283915
#>  8 Chile          Americas             355667           9457            328327
#>  9 United Kingdom Europe               304793          46204              1439
#> 10 Iran           Asia                 304204          16766            263519
#> # ... with 178 more rows
Below displays an example cumplot for confirmed cases in Asia
cumplot("confirmed", "Asia")