Cumplot
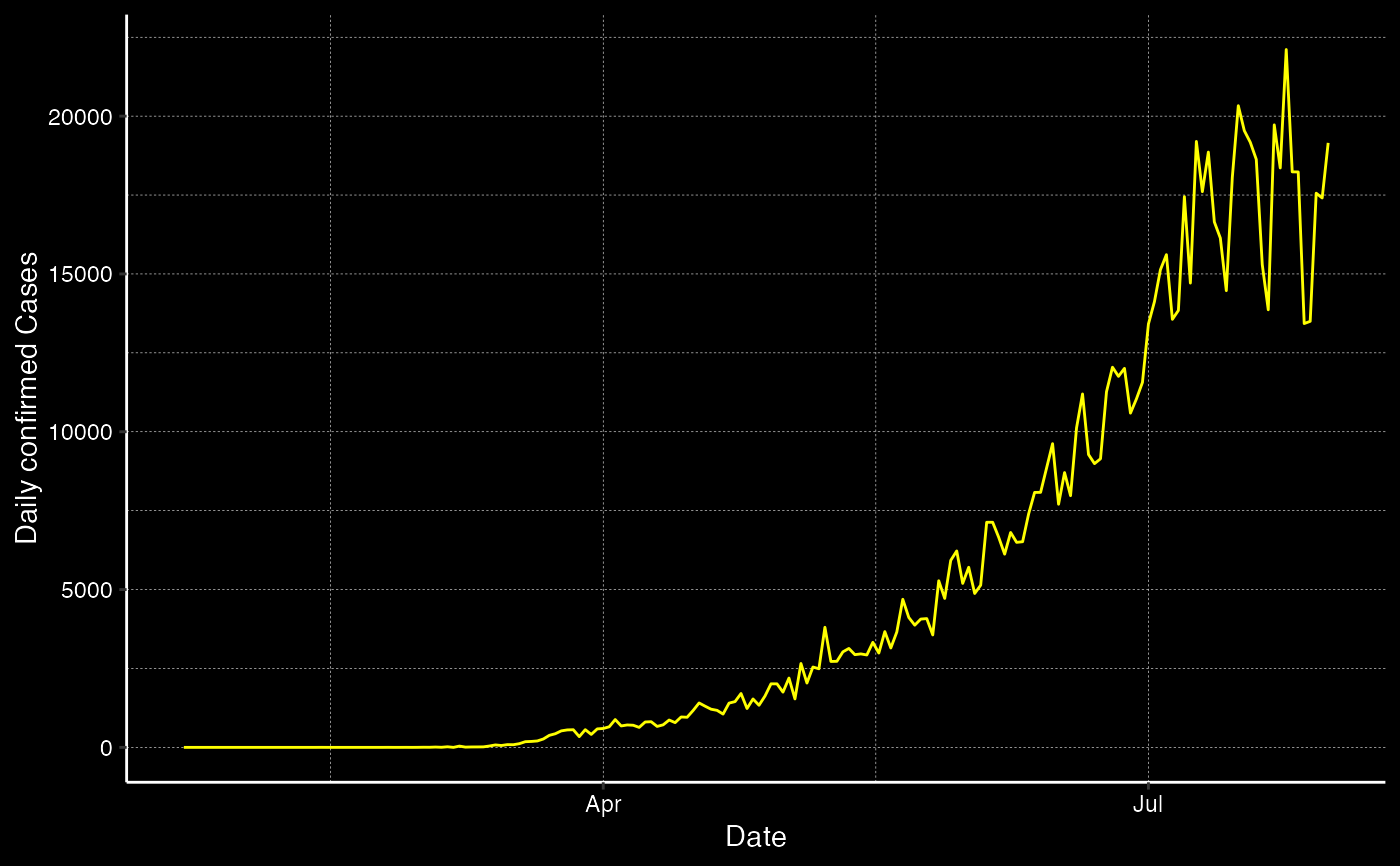
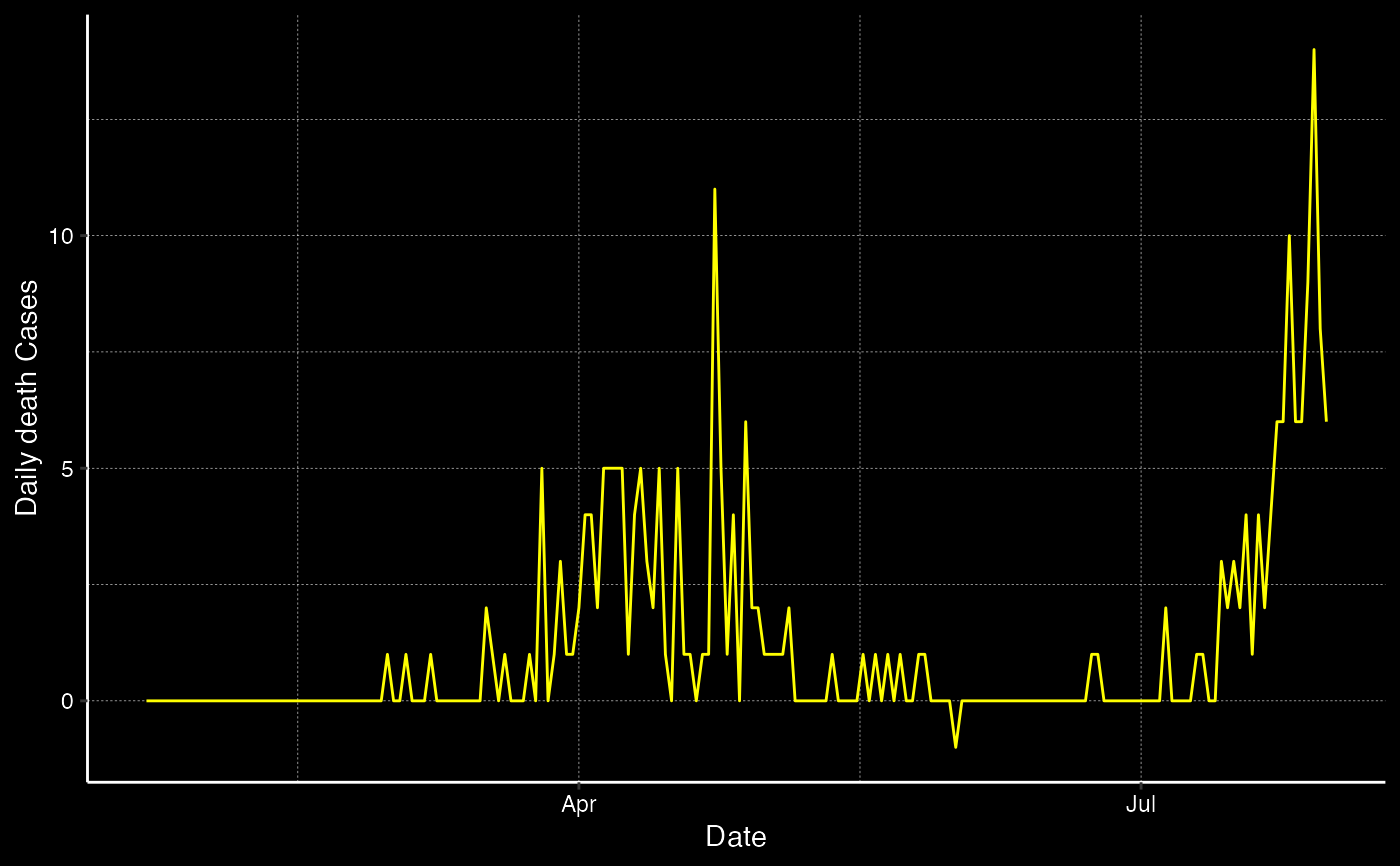
cumplot.RdThis function produces a line graph of coronavirus cases for a selected case type and continent with date on the x-axis and daily cases for the selected Type and Continent on the y-axis.
cumplot(Type, Continent)
Arguments
| Type | The case type to be plotted being: confirmed, death or recovered |
|---|---|
| Continent | The Continent to be plotted being: Africa, America, Asia, Europe and Oceania |
Value
The line plot plotting the date on the x-axis and daily cases for the selected Type and Continent on the y-axis
Examples
cumplot("confirmed","Africa")cumplot("death","Oceania")