Covid Statistics
covid.RmdData Description -
This package provides the
covid_colsadataset which contains 35 variables for Covid stats in Colombia and South Africa from January 2020.The data comes from Guidotti, E., Ardia, D., (2020), “COVID-19 Data Hub”, Journal of Open Source Software 5(51):2376, doi: 10.21105/joss.02376, through the R package “COVID19” and filtered for the country Colombia and South Africa.
covid_colsa
#> # A tibble: 542 x 35
#> # Groups:   id [2]
#>    id    date       tests confirmed recovered deaths  hosp  vent   icu
#>    <chr> <date>     <int>     <int>     <int>  <int> <int> <int> <int>
#>  1 COL   2020-01-22    NA        NA        NA     NA    NA    NA    NA
#>  2 COL   2020-01-23    NA        NA        NA     NA    NA    NA    NA
#>  3 COL   2020-01-24    NA        NA        NA     NA    NA    NA    NA
#>  4 COL   2020-01-25    NA        NA        NA     NA    NA    NA    NA
#>  5 COL   2020-01-26    NA        NA        NA     NA    NA    NA    NA
#>  6 COL   2020-01-27    NA        NA        NA     NA    NA    NA    NA
#>  7 COL   2020-01-28    NA        NA        NA     NA    NA    NA    NA
#>  8 COL   2020-01-29    NA        NA        NA     NA    NA    NA    NA
#>  9 COL   2020-01-30    NA        NA        NA     NA    NA    NA    NA
#> 10 COL   2020-01-31    NA        NA        NA     NA    NA    NA    NA
#> # … with 532 more rows, and 26 more variables: population <int>,
#> #   school_closing <int>, workplace_closing <int>, cancel_events <int>,
#> #   gatherings_restrictions <int>, transport_closing <int>,
#> #   stay_home_restrictions <int>, internal_movement_restrictions <int>,
#> #   international_movement_restrictions <int>, information_campaigns <int>,
#> #   testing_policy <int>, contact_tracing <int>, stringency_index <dbl>,
#> #   iso_alpha_3 <chr>, iso_alpha_2 <chr>, iso_numeric <int>, currency <chr>,
#> #   administrative_area_level <int>, administrative_area_level_1 <chr>,
#> #   administrative_area_level_2 <lgl>, administrative_area_level_3 <lgl>,
#> #   latitude <dbl>, longitude <dbl>, key <lgl>, key_apple_mobility <chr>,
#> #   key_google_mobility <chr>
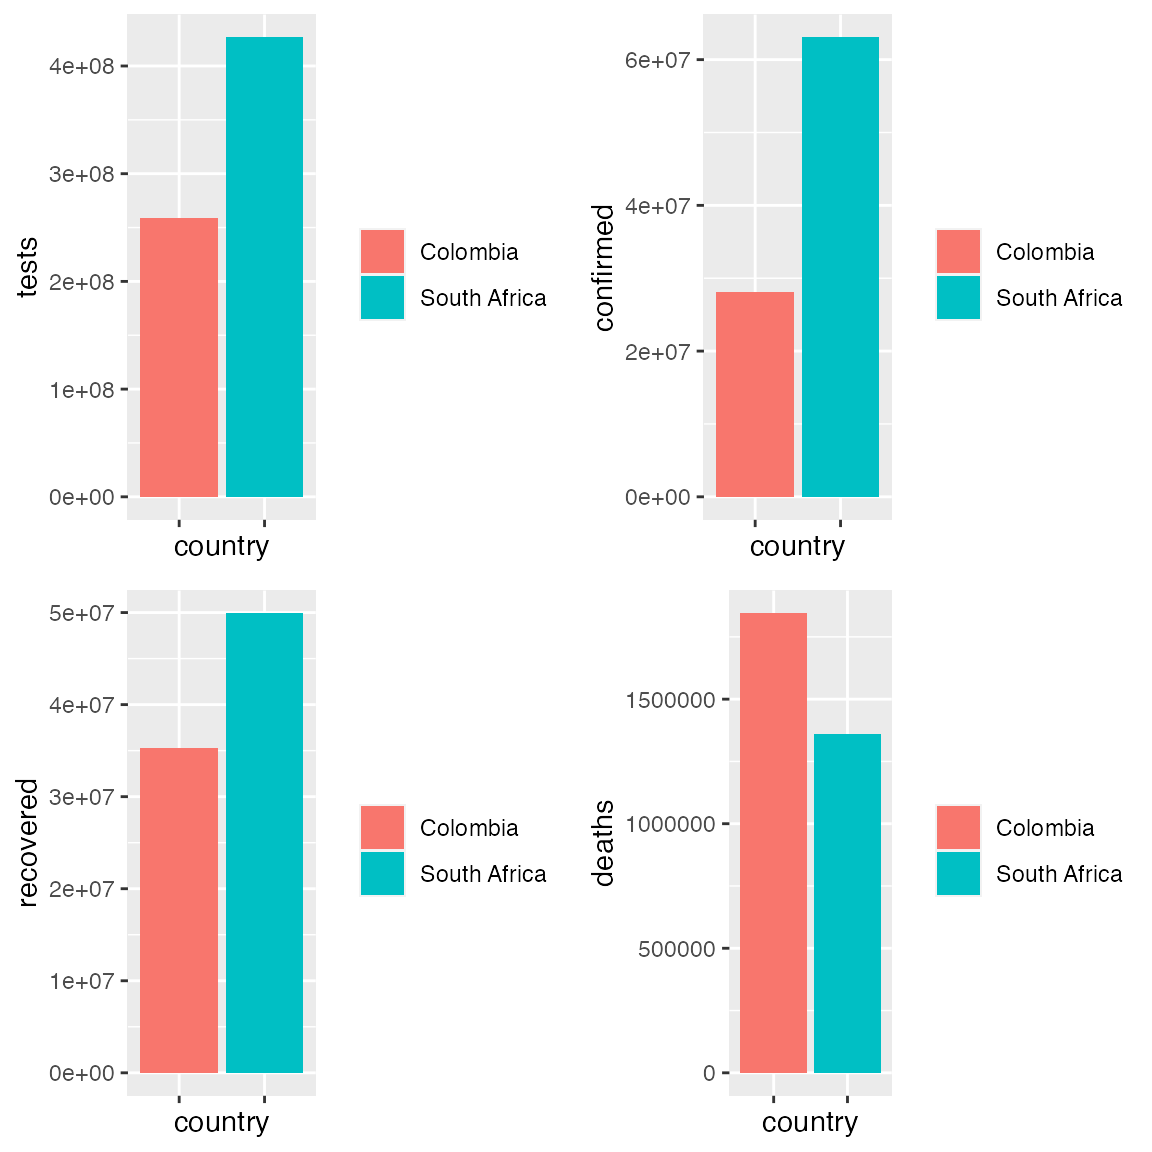
t <- ggplot(covid_colsa) +
      geom_bar(aes(x = key_apple_mobility, y = tests, fill = key_apple_mobility), stat = "identity") +
      theme(legend.title = element_blank(), axis.text.x = element_blank()) + xlab("country")

c <- ggplot(covid_colsa) +
      geom_bar(aes(x = key_apple_mobility, y = confirmed, fill = key_apple_mobility), stat = "identity") +
      theme(legend.title = element_blank(), axis.text.x = element_blank()) + xlab("country")

r <- ggplot(covid_colsa) +
      geom_bar(aes(x = key_apple_mobility, y = recovered, fill = key_apple_mobility), stat = "identity") +
      theme(legend.title = element_blank(), axis.text.x = element_blank()) + xlab("country")

d <- ggplot(covid_colsa) +
      geom_bar(aes(x = key_apple_mobility, y = deaths, fill = key_apple_mobility), stat = "identity") +
      theme(legend.title = element_blank(), axis.text.x = element_blank()) + xlab("country")

grid.arrange(t, c, r, d)
#> Warning: Removed 89 rows containing missing values (position_stack).
#> Warning: Removed 128 rows containing missing values (position_stack).
#> Warning: Removed 91 rows containing missing values (position_stack).
#> Warning: Removed 97 rows containing missing values (position_stack).