Overview
The goal of COVID19top4 is to launch a shiny application for the coronavirus dashboard which shows the visualizations and analysis for the top 4 COVID affected countries as of October 2020. The package also contains functions which help launch the application and some UI and server functions for the user to use. There are a couple of datasets for the user to use within the package which also was used for the analysis and visualizations of the shiny app.
Installation
You can install the COVID19top4 package on GITHUB with:
# install.packages("devtools")
devtools::install_github("https://github.com/etc5523-2020/r-package-assessment-Varsha-Ujjinni-VijayKumar")
Example
To run the app use the R code mentioned below.
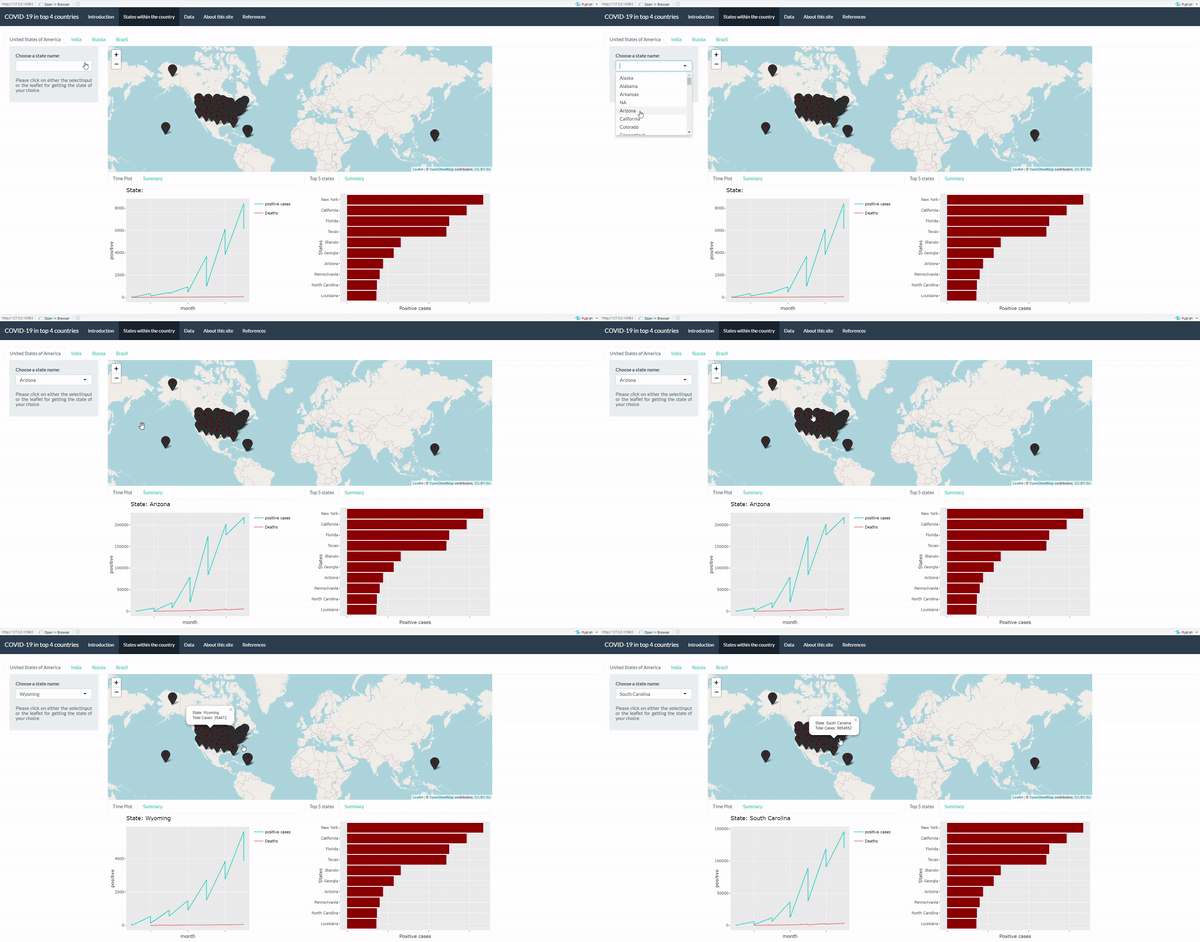
Below is a basic preview of the app in action.

Other functions within this package:
creates a select Input for states:
stateInput(id,x)
returns leaflet maps:
leaflet_maps(longitude,latitude,state_name,total_cases)
This is a basic example which shows you how to you can use the datasets within this package:
library(COVID19top4)
corona
Datasets available
-
corona: This contains filtered data for USA,India, Brazil and Russia from the COVID19 package of CRAN. -
usa: This contains the cases, recovered for United States of America and its states. -
india: This contains the number of cases, recovered and deaths for India and its states. -
brazil: This contains the number of cases, recovered and deaths for Brazil and its states. -
russia: This contains the number of cases, recovered and deaths for Russia and its states. -
USA_distinct: Distinct states for USA and their individual counts. -
IND_distinct: Distinct states for India and their individual counts. -
BRA_distinct: Distinct states for Brazil and their individual counts. -
RUS_distinct: Distinct states for Russia and their individual counts.
The image source for the logo is from hatchful

